
Now wind is a very complicated thing to model. You need to think about ocean currents and cyclones and anti-cyclones and the like. I'm going to completely ignore all of that, because I'm only interested in making rain patterns that seem more or less believable, and whether they're really exactly realistic doesn't matter so much.
As mentioned in the previous post, I'm assuming two kinds of wind: prevailing, and monsoons. Let's deal with the prevailing winds first.
Prevailing winds basically blow in bands around the Earth. These are very complex and involve things like Hadley cells and Coriolis forces. I'm going to ignore those and just make a stripy wind map. The stripes won't be completely straight, because that would mean we end up with deserts with straight edges and the like, but the wobbles will be random. I've already used splines to draw the sea ice boundaries, so I'll do the same thing here; it's actually simpler because I'm going to ignore any effects caused by the land and the oceans and just give them random nudges. The size of these nudges is random, from world to world. This world seems to have quite large nudges to the stripes, because as you can see, some of them are very wobbly:

Cyan represents easterly winds, purple represents westerly winds, and the darkness of the colour represents the typical strength of the winds. From top to bottom, we have: the polar easterlies; the subpolar low (very weak winds); the westerlies; the subtropical high, also known as the Horse Latitudes, where there are no prevailing winds to speak of; the northeast trade winds; the intertropical convergence zone; the southeast trade winds; another subtropical high; more westerlies; another subpolar low; and the polar easterlies again.
In reality, the winds within these bands are blowing in lots of different directions, but I'm ignoring that and decreeing that any point that's cyan on this map has its wind coming from the east, and any point that's purple has its wind from the west, and that's it. It's horribly crude but it works well enough for my purposes.
Now we can track rainfall. First, we'll do the rain over the oceans. This isn't really very realistic - there ought to be considerably more rain near the equator - but I'm not really much bothered about ocean rainfall, so I'm just doing this for completeness's sake. Here again I use yet another fractal to add some variation to the rainfall. The main thing here is the rain shadow from land: sea that lies to the leeward of land gets much less rain. We can model this fairly easily, if crudely, by going over the map and identifying any sea point that has land to the east (or west, depending on the direction of the wind). We can then just count how many land tiles there are in that direction, which determines the drying effect of the land (more land, more drying). Then we move in the opposite direction, over the sea, removing precipitation. This is the result:

(Like the temperature map, the precipitation map shows the annual average, but it's keeping track of both winter and summer precipitation separately.)
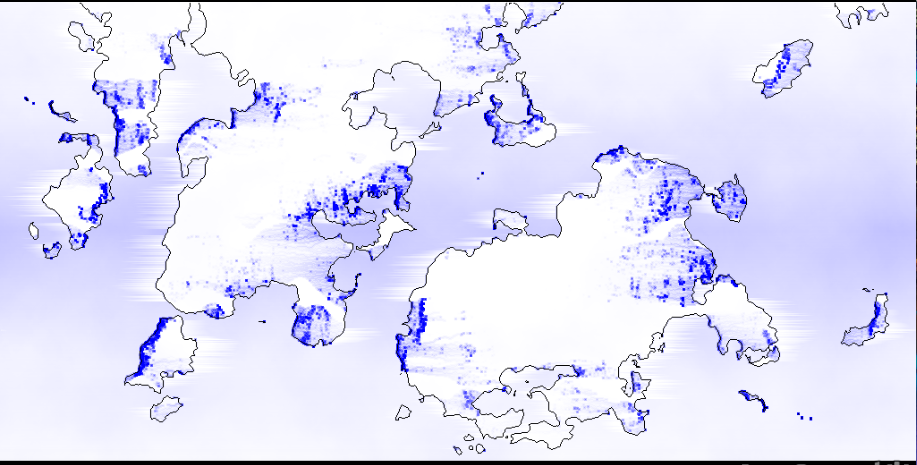
Now the much more important land precipitation. This is calculated in much the same way, but in reverse. We go over the map identifying points of land that have sea to the east (or west, depending on the direction of the prevailing winds). Then we cast across the sea to see how much sea the wind has travelled over. The more sea in that direction, the wetter the wind. Then we track the wind in the opposite direction over the land. As it goes, it deposits precipitation and becomes drier. If it encounters sharply rising land, it deposits a lot of precipitation. To make it a little more realistic-looking, we allow the wind to meander somewhat as it moves over the land, and when it deposits the precipitation it does so in large blobs. This is meant to soften the straight lines that this model produces.
Having done that, the program goes over the whole thing again and adds seasonal variation. Basically, the greater the temperature difference between winter and summer, the more of the precipitation gets diverted from summer to winter.
This is the map that results:
Take a moment to compare that to the heightmap:

You can see that how, despite its simplicity, the model is giving fairly believable results. Coastal areas where the prevailing winds blow in from the sea get plenty of rain, while the interiors of continents do not. Mountain ranges experience heavy rainfall and produce rain shadows on the land behind. Anywhere that has weak or non-existent prevailing winds gets very little rainfall.
But this is only half the story. By itself, this rainfall model leaves most of the world desert. You could never get rainforests with this model. That's because we need to add the other kind of winds - and the rains they carry - namely monsoons.
Now monsoons are trickier than prevailing winds, because they blow from the sea to the land, no matter what direction it's in. So we can't get away with making them go in just one or two cardinal directions.
UW goes over the map and identifies the land points. It checks that they're sufficiently tropical in latitude and that they have a sufficiently large difference between winter and summer temperatures (the greater the difference, the stronger the monsoon). Then it looks for the closest sea and works out how far that is. If it's too far, then there's no monsoon.
If there is monsoon present at this point, then UW traces an imaginary line from the coast to this point. If it encounters rising land, then monsoon is present there too. Otherwise, the monsoon occurs just at the point being examined. So monsoons can have rain shadows, just like prevailing winds.
Now doing this for every point of land on the map takes forever, so UW just examines a sample of points, and the monsoons are blobby. (It's also clever enough, when assessing the distance to the sea, to know that if the sea is too far then nearby points will also be too far and don't need to be checked.) The result is an algorithm that doesn't take too long but gives a reasonable map of monsoon strength. Here it is (monsoon effects are marked in red):

Monsoons cause less rain in winter and much more in summer. So if we apply these effects to the existing rain map, we get the following:

That is looking better. Now areas reasonably near the coast that aren't too far from the equator get lots of rain in the summer, even if they don't get any rain from the prevailing winds. Moreover, since prevailing winds tend to add rain in winter, areas that get both will have rain all year round, allowing for nice rainforests.
We're not done though. I found, when calculating climate zones, that things still weren't looking quite right. In particular, Mediterranean-type climates were almost non-existent. I solved this in my typically ad hoc way through brute force: we add some random and very simple high pressure zones at roughly the right latitudes. Near the coasts, they reduce rainfall in winter; further inland, they reduce rainfall in summer. This is what they look like:

Applying the effects of those to the rainfall, and also applying a Gaussian blur to the whole thing, we're done:

...except we're not, because now we have to go back and tinker with the temperature map, because rainfall raises temperatures during winter and lowers them during summer. This nicely models the moderating influence of oceanic winds on climate, which in the real world causes both western Europe and western North America to have milder climates than their counterparts on the eastern edges of their continents. Here's the final temperature map:

And that's precipitation pretty much done for now. That means we now have the information we need to calculate climate zones - temperature and precipitation in both summer and winter for every point on the map. As I mentioned before, Undiscovered Worlds analyses the climate using the Köppen classification system. Its analysis isn't perfect, because to do it really properly would require year-round information rather than just two months of the year, so there's a bit of guesswork involved, but not too much. (Also, some of the Köppen categories overlap with each other, so it's not always obvious how some areas should be classified.) Here's the climate map (including sea ice):

Compare that to the climate map of Earth (using the same colour scheme, though no sea ice):

It's not exact - in particular our map seems to have a lot less subarctic (Dfc, the greenish one over most of Russia and Canada) and a lot more Mediterranean-influenced subarctic (Dsb, the purplish one). That may be because UW is categorising them slightly differently from the maker of the Earth map - as mentioned above, the distinctions between the different categories aren't always as clear as you'd think - or it may because the world we've created really would differ in that respect. Still, I don't think the difference between two different types of subarctic climate is huge enough to worry about it unduly. Overall, I think UW's climate map looks broadly plausible for that world. In which case, we're basically done with climate, can heave a huge sigh of relief, and look forward to the next challenge: rivers.
I love what you've done here. It looks really nice!
ReplyDeleteYou may find some of my posts on climate generation interesting. I've also had some trouble getting Dfc to generate where I think it should be - You'll also notice that on the real map, Af blends quite nicely into Am/s, whereas in my experience, generated Af climates butt right up to deserts way more than I'd like.
https://forhinhexes.blogspot.com/search/label/Climate
DeleteEverything in your blog is interesting! Clearly you're going into much more detail than I am, and for quite a different purpose, but it's very helpful to read how other people are tackling some of these similar issues. My attitude towards the climate zones is that they're a tool rather than a goal, to help see how plausible the temperature and precipitation are by providing a visualisation that can be compared to reality. (I only started modelling this stuff in the first place in order to work out where the rivers should go!) And of course, as long as you're simplifying the processes and calculations, as we inevitably are, it's never going to be perfectly accurate. But that's OK, I think.