Sunday, December 26, 2021

Volcanoes

In his very influential post on map generation, Martin O'Leary commented that one thing he'd like to see done was volcanoes. So I've added volcanoes.

There are lots of different kinds of volcanoes, but for our purposes we'll just distinguish between shield volcanoes - which are broad with shallow slopes (such as those on the islands of Hawaii) - and stratovolcanoes - which are tall with steep slopes (such as Vesuvius). Most volcanoes are stratovolcanoes.

We can also distinguish between volcanoes that occur at boundaries between tectonic plates - more specifically, where oceanic plates are pulling away from each other (e.g. the Mid-Atlantic Ridge), and where oceanic plates are subducting underneath continental plates (e.g. the Andes) - and hotspot volcanoes, which are much rarer and occur just about anywhere.

It's easy to add volcanoes in mountain ranges that are drawn along the edges of continents. They don't stand out, because they're part of mountain ranges, but they're there. Hotspot volcanoes take a little extra work. For one thing, hotspot volcanoes often have extinct volcanoes nearby, because of the movement of the tectonic plate over the hotspot beneath. So UW creates those too. There isn't any functional difference between an active volcano and an extinct one other than that if you click on the crater of an active volcano it will tell you it's a volcano.

Stratovolcanoes appear as isolated peaks, with perhaps a subsidiary peak or two with their own craters. Here's a line of them - the one to the southeast is active, while the others are extinct volcanoes formed by the same hotspot in earlier ages:

They look pretty small on the regional map, as you can see, but bear in mind that this map is at a scale of one pixel per kilometre. Compare the scale and general shape of Vesuvius, and I think these are about right:


Shield volcanoes, meanwhile, are done by raising the land round about to create a wide, gradual slope, surmounted by a relatively low peak with a system of nice buttresses around it. These are much rarer than stratovolcanoes but can be quite impressive features when they do appear:

And here is a chain of shield volcanoes. The one furthest to the east is the active one, and the others are extinct. I like how lakes have unexpectedly formed on the slopes of this volcanic range (the active crater is just to the east of that lake in the centre of the last volcano):

(I know it looks like that river is going over the flank of the volcano to the west - it isn't really, it's running through a canyon between the volcano and the hills just to the west.)

Submarine volcanoes are also important, and we create them in a similar way to stratovolcanoes on land, with solitary peaks rising from the seabed. Again, the ones around the oceanic ridges mostly blend into those ridges, but the ones in other areas are more noticeable, especially if they have chains of extinct seamounts associated with them. Hotspot volcanoes are more common in the oceans than on land - unsurprisingly as oceanic crust is thinner than continental - and they tend to clump in particular areas, so UW models that too. Sometimes these rise above sea level and create volcanic islands:


Here's a close-up shot of some islands I liked - the large island has a stratovolcano in the middle, with three active craters. The whole island is covered in tropical rainforest. Clearly a good place to bury some pirate gold.


And of course the import feature now lets you import volcano maps, so you can add them to your custom worlds. This means that Mount Doom and the Lonely Mountain can be added properly to Middle Earth, which is clearly a major step forward.


Gondor came out a bit nicer this time too!

Tuesday, November 23, 2021

Tinkering and tweaking

I've been doing some unglamorous tinkering with the app, mostly to do with trying to make the regional relief maps prettier. In addition to bug-squashing, I've added the following refinements:

  • The roughness levels of most terrain have been raised, sometimes fairly drastically. I think the rougher terrain simply looks better, as the texture of the ground appears much more interesting (I'm not sure how realistic it actually is, but still, I like the look). But of course smoother terrain still occurs as well, as we want variety above all.
  • I've made seabeds smoother, which makes for a much nicer appearance with fewer undesirable artefacts. (Deep sea trenches look especially ominous now.)
  • Polar coastlines had a tendency to be very straight and dull-looking, for some reason which I've been unable to track down. I've bodged the issue by simply creating new routines to make them more fragmented and interesting. (This is quite apart from the much more crinkly fjords, of course, which appear where mountain ranges meet the coasts in colder areas.)
  • In areas where land is removed by applying a fractal, there's now a (small) chance of small islands being scattered over the area. The islands are made by building short mountain ranges, or isolated peaks (like extinct volcanos), in the water. This makes for a nice Aegean sort of appearance, with archipelagos of small mountainous islands, which adds more variety to the global maps.
  • Previously, the transition between arctic and subarctic areas was drawn gradually in the relief maps, with a smooth shift from tundra colours to white. I've added two new ways of showing this transition - one with a sharp change from tundra colours to white, and one with a speckled intermediate zone. The sharp change is the new default, as I think it looks best, but the others can be chosen in the visual settings menu.
Here are some sample images.

Rougher terrain:


Seabeds:


Polar coastlines:


Small, mountainous islands:


Snow transition zones:


More tinkering and checking to come, then I will hopefully be in a position to release something.

Tuesday, October 5, 2021

We have but slept for five million years

 I've made a few small tweaks to the program to improve the appearance of regional maps:

(1) Low mountains and hills are more likely to use wider peaks, giving them a more rounded and gentle appearance compared to higher ridges and peaks.

(2) Transform faults in mid-ocean ridges have been turned off, at least for now - they look too messy most of the time.

(3) Shading on ocean seabeds has been reduced for small differences in elevation, to avoid the kind of artifacts seen in the second map here.

(4) Semi-arid areas are depicted as slightly greener.

The main addition, though, is one I was considering for a while: custom worlds. It is now possible to import your own maps into Undiscovered Worlds and have it calculate the climates, rivers, and so on. You can then explore it, and export maps, just as if it were a world generated from scratch.

Here's what the new import screen looks like:


You can import three kinds of maps. Each needs to be a png image file the size of the global map. A land map is a heightmap for the land and a sea map is a depthmap for the sea (only needed if you want to specify sea depths - you don't have to import one), which are both pretty self-explanatory. The mountains map is needed because of how the program handles mountains: they are not simply high areas on the global map, but store ridge direction information as well. Luckily I managed to make it fairly simple to do. The user need only create another global-scale image with lines indicating the heights of the central ridges of the main mountain ranges. UW then draws more complicated ranges running along and around these, including working out how the ridges intersect.

So, for example, if the user draws a single line on their mountains image and imports it into UW, it creates mountains that look like this at the regional scale:


And I think these look reasonable.

As you can see, the import screen also allows you to generate various features on your map once you've imported the heightmaps. You can remove straight coastlines, generate continental shelves and mid-ocean ridges, add random variation to both sea beds and the land if desired (this means that you could import just flat heightmaps for the land or sea and have UW create variation in elevation, if you don't want to do it yourself). Finally, you can add smaller mountain ranges, hills, and also island chains, all randomly placed.

When you press the big button at the bottom, UW does a few additional processes such as removing depressions and adding gentle slopes to the land, and then calculates all the climates, as well as the river courses, lakes, and so on. Once that's done the world is finished and you can explore it at the regional level, and of course export maps with your preferred colour schemes, to do with as you will.

With luck, this should provide enough control for hopeful Slartibartfasts to sketch out the outlines of a world in whatever paint program they like, and then have UW fill in all the details.

I thought I'd test it out myself. I adapted this map of the Third Age of Arda to import into Undiscovered Worlds. I only did basic land outlines, and mountain ridges - the scale probably isn't quite right but I tried to get it as close as possible. I had to pretty much guess the heights of the mountains. Importing these two sets of data into UW, I added random elevation, and also random hills scattered about, so it won't exactly match Tolkien's physical terrain (to the extent that he ever specifies it precisely at all). Also, I cheated a bit by making the two large salt lakes in Tolkien's map into patches of actual sea, to ensure they appeared in the right locations.

I tried running this through UW a number of times and found that the results could vary quite a lot, depending on how the winds were generated (it's pretty random), as well as depending on where random hills get plonked down, plus all kinds of other small differences that can translate into quite significant variation. In some versions, Gondor was a huge desert. In some, the River Anduin swerved west and flowed out through the Gap of Rohan.

Here's a version that seemed to me quite pleasant-looking:

Obviously the only bit we really care about is the northwestern part of Middle Earth, so this is what that area looks like:

Here are the climates of that same region (using this colour scheme):


Some of the differences here, compared to Tolkien's maps, are purely physical. The Misty Mountains don't represent such an unbroken barrier as they should - Frodo and company could have found their way through any number of accommodating passes on this version of the map. The same applies to the Ash Mountains, to the north of Mordor. This is a result of how the program translates simple lines in the imported mountains image into tolerably believable mountain ranges - it has to mess about with them to some extent, and I can't remove that without making them look generally worse.

In addition, of course, there are various ranges of hills that aren't on the original maps, which I had UW add randomly. You need a good scattering of these to give the terrain a bit of texture, but it might mean that the watercourses aren't quite as you'd expect.

Instead of one major river running south, to the east of and parallel to the Misty Mountains, we have a number of rivers heading more or less due east. More significant rivers are found to the west, where you'd expect more rainfall - and indeed, to the west of the mountains UW places humid continental climates, giving way to temperate oceanic closer to the coast. The Shire straddles these two climatic zones, which also makes more sense than having it all temperate oceanic (as I assume it is for Tolkien, as it's meant to resemble England). It is, after all, further inland than England is in real life.

Gondor turns out to be quite arid again, but the main surprise here for me is Mordor, which looks a lot pleasanter than one might expect. The climate is mostly humid continental, giving way to subtropical in the south. I think this is because I made the mountains to the south fairly low, which is how I imagined them, and they didn't provide much of a barrier to the moisture blowing in from the southwest.

Obviously it's hard to say how many of the discrepancies are down to Tolkien's errors as a world builder, or down to UW's deficiencies as a world modeller, or down to my own errors in translating the maps to match the projection used here. Probably it's a combination of all of these factors.

Anyway, there's a quick demonstration of what you can do with the import feature. I hope people will find it useful who would like to sketch out a world and then have the computer calculate the climates and show roughly what it might look like.

Sunday, August 29, 2021

Tinkering with tools

Now that the actual terrain generation is mostly done (barring a few bugs, of course), I've been messing about with the UI, and I've added two new features that I've wanted to add for a while.

The first is the ability to change the colours and other settings used to generate the relief maps:


As you can see, you can change all the colours (thanks to the stylish colour wheel that comes with Nanogui), and also change the strength (and direction) of the shading, as well as the marbling effect and how many rivers will be shown. This allows the user to customise the look of their maps to quite a high degree from within the app. The settings stay with the world if you save it and load it later, and you can also save the settings themselves to apply to another world if you want to.

The second new feature is the ability to generate, and export, maps drawn to regional scale but of larger areas. The user can simply mark out an area on the global map that they'd like detailed maps of, and UW will draw the maps and save them to the hard drive. (You can't view them within UW, but you can of course open them in whatever other program you like.) So you can have maps like these:


That last image is pretty huge (3441x2017 pixels)! (It has the shading on land cranked up to maximum too.) As you can see, it's now possible to create detailed maps of entire continents if you so choose, as long as you don't mind waiting for them (the last one took a couple of minutes). It might in theory be possible to create a detailed map of the entire world, but I haven't tried...

The only feature left to add is the ability to import your own heightmap and have UW turn it into a complete world, including working out all the climates and rivers and so on. Some people have requested this, and I'd like to add it, but it would be a little complicated because I need to work out how to do mountains. (Remember, Undiscovered Worlds' mountains are not simply areas of high elevation on the heightmap - UW also stores ridge directions and connections, which are additional data. So I need to think of a way to create that data from raw heightmaps.) I want to avoid feature creep, so I may leave this to add at a later date, after I've released the first version. If I do that, then once I've squashed the more prominent of the remaining bugs and worked out how to actually create a standalone app, I'll be in a position to release it and let other people play with it.

Wednesday, August 18, 2021

Finishing the sea floor


Mid-oceanic rifts, with their associated ridges, are a really prominent feature of underwater terrain. The most famous one is the Mid-Atlantic Ridge:

But it's not really a single, discrete feature - rather, it's part of a network of rifts of this kind that wrap around the whole world, where oceanic plates are pulling apart from each other.

If we think of these rifts as basically arising at the mid-points between continental shelves, it's not too difficult to trace their paths. I can adapt the method I used to find 
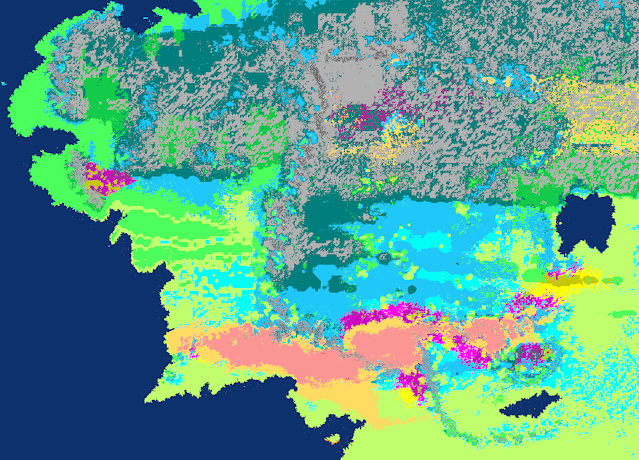
the midpoints between mountain ridges. First, we place seed points along the edges of the continental shelves. Then we identify all the points next to those points. Then all the points next to those points - and so on until there are no points left. On each turn, we simply note down, for each point visited, which turn it was that we met it on. The result is an approximate map of how far each point of the ocean is from the nearest continental shelf, which we can represent like this (the lighter they are, the further):


Something weird happened in the western ocean there. It's something to do with the point at which the western boundary of the map meets the eastern (remember, after all this, the map gets adjusted east/west so that the boundary falls in the middle of the ocean, so the artefact there reflects where that boundary was before the adjustment). I can't work out quite why this happens, but it doesn't really matter, as we shall see.

Now the mid-oceanic points are those where two neighbouring points are closest to two different shelf points that are sufficiently far apart from each other. We can pick these out like this:


Obviously these are much too regular-looking. But we can do something about this by adapting the methods I used to make interesting continental shapes. First, we make an imaginary grid with squares a few pixels wide. Then we go through each intersection on that grid. If it's close enough to one of the points identified on the map above, we mark it. That gives us a set of points on a grid. Each one gets assigned a unique number, and we also identify its neighbours on the grid. If we draw lines between neighbouring points, we get an effect pretty similar to the previous one (now I'm drawing these lines on the elevation map itself):


However, because these lines are based on a list of points with known neighbours, and are not simply being read off a 2D array, it's now easy to move those points about and get wigglier lines. As with the continental outlines, I apply two transformations to them. One is based on a fractal, which determines how far north/south and east/west each point is moved. That means that each point is moved a similar (though not identical) distance to its neighbours. Second, each point gets a random nudge all of its own. Together, these two transformations give us a much more realistic map of oceanic rifts:


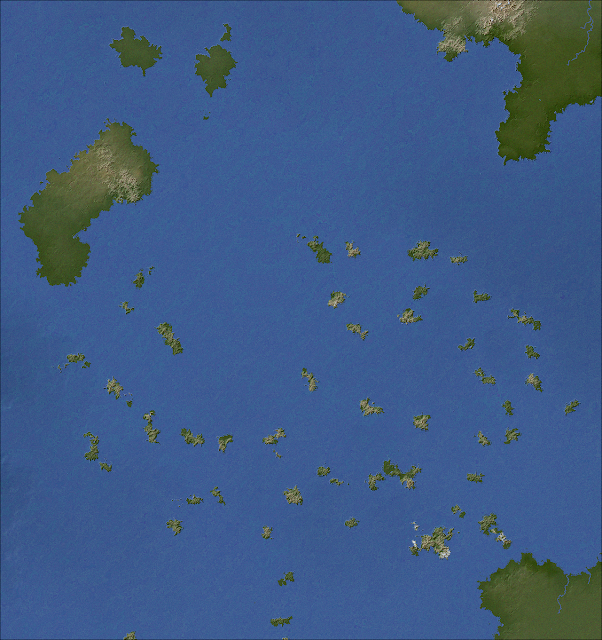
That looks a lot better. The rifts come and go, depending on the distance to the nearest continental shelf, but this should be fine as we can easily make the ridges' height depend on that distance, so they will fade in and out. If we do that, and also make the ridges wider, we get this:


I think that looks pretty good at the global level. At last, we can see where the tectonic plates of the world must be, even though my method doesn't actually simulate them at all!

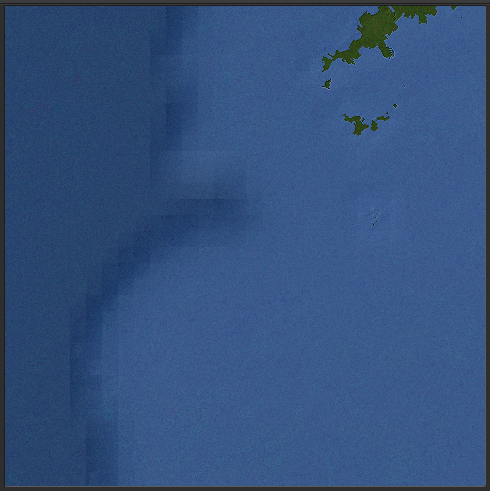
At the regional level, though, it's not quite as impressive:


The ridge is completely undetectable! It is there - it's just that because it covers such a large area, the slope is gradual enough that you can't really see it. Clicking on different parts of the regional map reveals the different depths, but the changes are just not dramatic enough to be noticeable on the relief map, or indeed on the elevation map either.

Well, we can help things by adding undersea mountains. Oceanic rifts have parallel lines of increasingly more minor ridges running alongside them. As we raise the land on the global map, we can note down the distance each cell is from the central rift. Cells that are the same distance from that central rift can have underwater mountain ranges connecting them. With a bit of tinkering to improve the directions of the lines, and the addition of extra mountain peaks scattered about to stop them looking too linear (and also to reflect the chaotic nature of this kind of terrain in real life), we get something like this (the central rift is just off to the left of this map):


It's also a straightforward matter to add the central rift itself, with a high density of additional peaks around it:


I noticed something curious in one area though:


Where have these lines come from that are crossing the ridges?? By a process of elimination, I work out that it's something to do with the routines that draw the ridges themselves (nothing to do with the central rift or the peaks around it, or the random peaks that are scattered among the ridges). My best guess is that it's something to do with the pseudo-random number generator, which is set to a different seed for each tile before making the ridges there. Each tile's seed is, in part, generated by its coordinates on the global map, as well as by other distinctive properties such as its rainfall or temperature. It must be that in this region, the seed numbers in each column are similar enough that they are producing similar random numbers for the peak heights, leading to the illusion of these lines. They are not perfectly vertical because the locations of all of the ridge peaks are warped slightly by a global-scale fractal, which pushes them by a varying amount across the map to reduce the appearance of a grid. 

I can't make this happen in the same way elsewhere - for one thing, it would only create lines running north-south or east-west. But I'd like to reproduce the effect, or something like it, as I think that, by chance, it looks fantastic.

To do this, we need to store some new information at the point of world generation. Each central ridge point needs to know the angle of the line that is roughly perpendicular to the ridge at that point. Now, lines of this kind do not, in fact, normally pass through the central ridge at exactly right angles:


So this is my solution. We make (yet another) global-level fractal. On the basis of this fractal, we assign an angle - between 0 and 360 degrees - to every point on the map, so we have a global map of gradually changing angles. (Note: this means that making this fractal is a little more complicated than usual, because the values have to be able to wrap - e.g. if we're trying to find the midpoint between 30 and 350, the answer is 10, not 190.)

At the ridge points, we take the average of (1) this fractal-based angle and (2) the angle of the line that would actually be perpendicular to the ridge at that point. We will then use this average as the angle of the lines that we will draw on the regional map at this point.

This method ensures that we keep the realistic effect of mostly roughly parallel lines that don't cross the ridge at exactly right angles, without allowing anything too crazy such as lines that cross the ridge at a very acute angle.

Now, at the regional level, we go through each tile that contains central ridge in turn. (We do this for a considerably larger area than is actually shown in the regional map, because there might be lines entering the regional map from ridges that are off-screen.) Then we just draw straight lines from those tiles in the appropriate directions. Some of these are raised ridges, while others remove any ridges they encounter. The length and exact direction get a random offset too.

It takes a fair bit of experimenting (as well as a lot more maths than I'm at all comfortable with) to get it looking reasonable, but I end up with maps like these:


And I think these look pretty nice. Sometimes these radiating spikes make more of a confused jumble, but that's OK - confused jumbles are what mid-oceanic ridges are all about, really.

Now comes the tricky bit. Oceanic rifts are also crossed by more substantial fault lines that actually break up and stagger the line of the rift itself:


These lines are transform faults in the sea bed, breaking up the ridge systems:


How do we implement these?

Well, on the global map, we choose some points on the rift network. For each point, we shuffle along the rift a little way in each direction, to identify a short length of rift. Now we can use the work we've already done in the last bit, when we identified the angle of those lines crossing the rift at every point. We use the angle of the line at the point mid-way along our section of rift, and basically just shift that whole section of rift, and all its associated ridges and other information, a random amount along the line indicated by that angle. And we do that repeatedly all over the map.

That gets us this:


I found that the lines slashing across the ridges looked rather ugly on the global map, so I have toned down the pseudo-3D shadows around them, which helps. On the regional map, the lines of the faults themselves aren't actually visible. Instead, these areas look like this:


It's probably not tremendously realistic, but it adds some pleasing chaos to parts of the rift system, so I'll leave it at that.

One more feature I want to add to the oceans, at least for now, is deep-sea trenches. These tend to appear on the edges of some oceanic plates, where they meet continental plates:


To simulate these, I'll just run along the edges of some of the continental shelves drawing blobs. Where the blobs cover ocean that isn't continental shelf, I'll drastically increase the ocean depth.

And that gives us this:

On the regional map, these areas look like this:


And I think that looks suitably profound and mysterious.

With that, I'll leave the sea floors for now. They're not tremendously detailed or accurate, but I'm aware that most people probably won't care too much about what's going on down there, so hopefully what we've got now should suffice to add a little bit of believability.

Next, some refinements to the UI, including the ability to customise colours and other elements of the appearance from within the program.

Thursday, June 24, 2021

Installing the shelving

The sea bed hasn't had much love from Undiscovered Worlds to date. I've basically just applied a bit of randomness from a fractal at the global level and left it at that - and completely ignored it at the regional level. But of course the real sea bed is far more complicated! We need to try to emulate the look of hydrographical maps if ours are to be at all convincing.


First, we need to sort out continental shelves. The sea bed doesn't just slope gradually down from the edge of the land - it remains relatively shallow for quite a way and then drops off fairly suddenly. This is where the continental tectonic plate ends and the oceanic tectonic plate begins.

A fairly basic approach to this isn't too hard to do. First, we go over the map and at every coastal point we draw a circle. The radius of the circles varies according to a fractal map. This means we get a gradual variation in size throughout the map:


That's a start. Now we also offset the circles by an amount that is also determined by a fractal map. That shifts the edges of the shelves in a slightly more interesting way:


Finally, we run the whole thing over a fine-grained Voronoi map to make the edges a little more interesting (and also to help fill in some of the gaps that appear from offsetting the edges in that previous step):


Note that this is done before we apply a fractal to the whole map in order to remove some land. That means that where land is removed in that stage, continental shelf is left behind. The map above doesn't have many areas like that, but you can see for example at the southern edge of that large continent in the middle, where there is a peninsula and an island. Those are the remains of a larger area of land that's been removed (compare the previous maps above, where this hadn't happened yet). The continental shelf still extends across this whole area, which I think looks pretty good.

After this we add just a few little tweaks. We choose some random points within the shelves to be the centres of circles which we flatten to the level of the shelf, to disrupt the edges a little. Then, we re-use the flood-fill routine to ensure there are no areas of oceanic depth within the shelves.

All of that gives us the basic shapes of the continental shelves. Now we can add some variation to their depth, as well as to the depth of the oceans themselves. As always, this can be done with another fractal. In addition, yet another fractal is used to vary the extent of the smoothing of the sea floor, making some transitions between continental shelf and ocean more abrupt than others. That (together with some tweaks to the colours and shading, and the addition of climates on the land) gives us this:


And that seems to me to be looking pretty reasonable. Note here that the additional processes involved in making the continental shelves have meant that more (pseudo-)random numbers have been used, which means that the random numbers used when subtracting some areas of land later in the map generation process are different. In this case this has led to some more substantial areas of sea within the continental plates, rather like the Baltic Sea.

Now how does this look at the regional level? It took some time to get this working at all, because I simply hadn't bothered with generating sea beds before, except as part of the coastal generation process. I found the best way was to create a whole sea bed terrain, distinct from the normal terrain, and then paste it onto the regional map wherever there was sea. That way, tinkering with the sea bed generation wouldn't mess up the very carefully balanced (i.e. tinkered-with-to-death) coastal generation.

Once that was done, I had this:


As you can see, that's unacceptably blocky. There isn't enough variation in the fractals in each tile to disrupt the tiles. I tried increasing the variation:


That is actually a pretty cool effect, but it's totally at odds with what I'm trying to do! It's caused by the edges of the tiles not matching, which is annoying as they're supposed to match.

Well, a day of tinkering sorts that out and I manage to get everything matched up and suitably bumpy:


The tiles are still very evident at the intersection of the continental shelf and the deeper ocean, though, no matter how much I crank up the noise. So I need to do something else to disguise this.

I came up with a variation on an idea I've used a number of times, which is to apply an irregularly-shaped template to a border area in order to disrupt that border. In this case I used some smudge templates with fuzzy edges, to make the disruptions blend into the rest of the terrain. I think it makes a decent-looking effect:


I don't know quite how realistic this slightly terraced look is, but I like it. (As with large lakes, though, I now have to create the seabed on a map much larger than the displayed regional map, and then trim away all the unseen bits. This is because the templates I'm using to create this effect are quite large, so they can alter the terrain several tiles away from where they are actually placed. This means that we need to calculate terrain for quite a wide area around the displayed area, to ensure that each tile will always look the same no matter where on the map it may appear. This is a hassle, and of course it increases the generation time, but I think it's worth it to get the better appearance.)

Now, real continental shelves often have much more complicated features at the transition to oceanic plate. For example, there are sometimes systems of trenches and canyons that look strikingly like river valleys, as with these off the coast of California:


These are caused by water currents and sediment flowing from the shallower areas to the deeper ones, and they carve out these canyon-like features.

The easiest way to mimic these is to think of them like rivers, and that means we can re-use the basic methods for calculating rivers. At least, you'd think so. After typing the above I spent two days first trying to rewrite those methods to apply them to this situation, and then trying to write new routines from scratch, before giving up. In a perfect world I'd have these canyons at the edges of continental shelves, and perhaps at some point I'll find a way to add them in, but for now I'm going to stick with what I've got (which does match the edges of most continental shelves anyway).

Next is the tricky part of sea beds: mid-oceanic ridges!